


How do you talk to your data?
A question that not too long ago, when said out loud, would make people look at you funny and move to the opposite side of the subway car. It’s real now.
Why would you talk to your data? Because, in an enterprise, data holds useful answers to get better with sales, marketing, supply management, or hiring practices. The average Joe manager can use a useful answer! But Joe will not write a SQL query. Joe can ask an analyst – but if possible, Joe would prefer to just talk with the data.
So, how do you talk to your data?
LLMs (generative AI, but I’ll say LLMs) can understand an English question. They can also write SQL for Joe’s question – many, many, many people are working on this. It works. Mostly.
But what if there is another way that makes talking to data 100x better? And a different place to apply an LLM-generating SQL than on the business end of a user question.
Hard Truths and Soft Decisions
Speaking of ways and places, let’s talk about Waze.
I like Waze a lot. I’m not a San Francisco native, which is why I recently had the misfortune to agree to an afternoon meeting in Pleasanton, California because it is “close by”.
Dear reader, never ever do that.

But if you do, Waze gives you the feeling you’ll get there. Eventually.
When Waze chooses a way, its guidance is probabilistic – there are multiple ways to get from SF to Pleasanton. Some ways are faster, some are slower, and some have a higher chance of getting shot. Waze tries its best, and we trust it to.
However, whether you reached Pleasanton, CA or not is binary. If you look around and see cowboys, you are probably not there. Location is a hard truth. The probabilistic Waze relies on other hard truths, like roads. You can only drive on roads (that is, unless you are LBJ).
Not following the hard truths leads people to lose trust in probabilistic machines. You drive a person into a lake just once, and it’s all they remember.
LLMs are probabilistic machines too – like Waze, they try to do their best. They are much smarter than Waze! You can ask an LLM not only how to get to Pleasanton but also suggest sightseeing along the way (just don’t ask for the shortest path visiting all stops).
LLMs can write anything, including SQL.
Which is why, this architecture of talking to data is so promising:
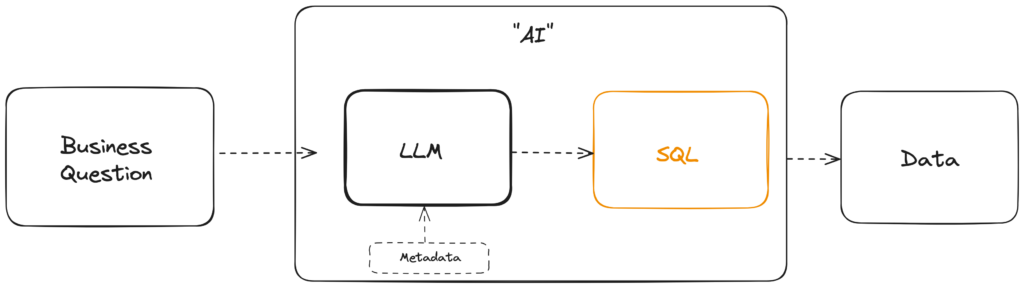
But what are the hard truths of data? What “roads” does it need to follow?
Hard Truths of Data
The basics are fairly simple:
- Where tables are located and what are the column names
- Does the SQL compile or not
But if your SQL compiles and uses the right data, it does not make it right.
A marketing manager using Google Analytics looks at the number of users,
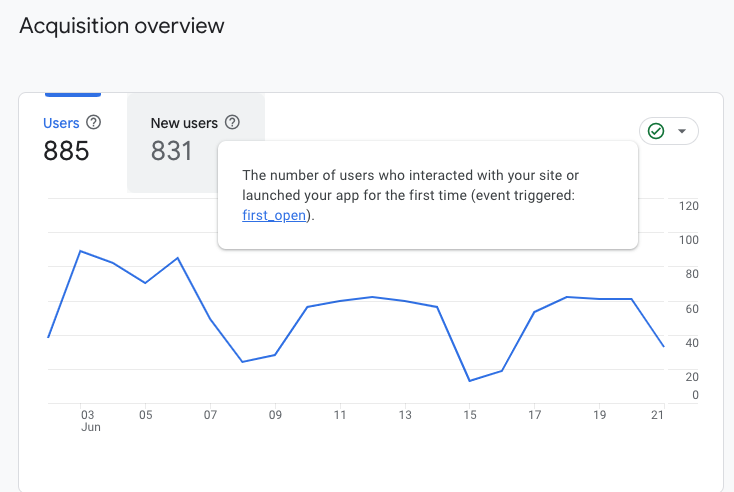
When Google Analytics data flows into Snowflake, and the marketing manager asks an LLM about data on the same date range, she would expect to see 885 active users and 831 new users. That’s her hard truth.
When she asks “How many people visited our website this weekend?”, she would love the AI to pick up that she meant a metric like “active user count” or “new user count”, or understand what “this weekend” means.
The choice of how to answer this question is probabilistic – she did not indicate whether she meant new, active, or total users. Any choice is “correct” – though some are better than others.
But then, if the AI picked up “Active Users”? That is either right – or wrong. There is no “almost”.
Mind you, the definition of how to count new or active users in Google Analytics is far from simple. It takes into it a notion of what is an “engaged session”. It distinguishes between activity on a website or an Android app. If you have a table with Google Analytics events, building that SQL correctly is not a small feat. Training an AI to do it right every time? Harder.
And then, definitions can change overnight. When that happens, all questions that use the old definition must use the new one. Even if AI picked up on the old one after enough training to be mostly correct, it needs to forget its training at once and start again.
This is why we’ll talk about the way to set hard truths for data: Semantic Compilers.
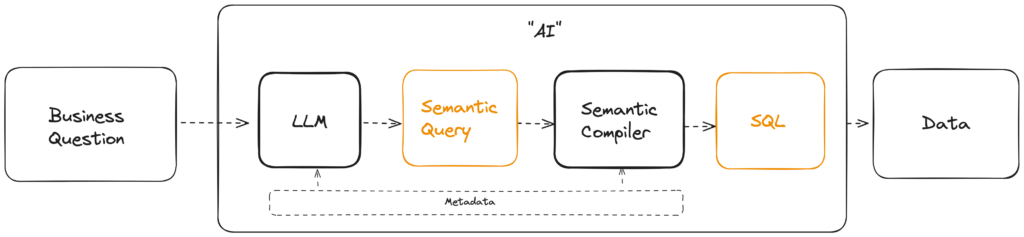
User asks a Business Question → LLM generates a Semantic Query → Semantic Compiler generates SQL → Data.
Job Of A Semantic Layer
Imagine the following flow:
- Define a metric (like active user count) in metadata: how it is calculated, where its data comes from, and how it is connected to other pieces of data like dates. That’s a Semantic Definition.
- Query it (”active user count where date = this weekend”) from some user tool. This is a Semantic Query. It does not concern itself with the how, only with the desired result.
- The Semantic Compiler gets the semantic query and compiles an actual SQL statement for it.
A semantic definition encodes the hard truths: what do you mean by “count active users”. A semantic compiler uses that definition to answer a question. An LLM (or a BI tool) asks the question. Together, they form a semantic layer.
With a semantic layer, a user says
How many users we had over the weekend
An LLM chooses an active_users_count metric and makes a semantic query like
 metrics: active_users_count
 filters: date BETWEEN '22-06-2024' AND '23-06-2024'
Semantic compiler gets this and says
... 1500 lines of SQL that actually calculate active user count
In the context of LLMs generating SQL, Semantic Compilers deal with the “hairy stuff” of data generation such as:
- Correct Metrics: know when and how to aggregate. Deal with derived calculations, with levels of granularity of aggregations, handle edge cases of ratio calculations, and understand additive and non-additive metrics.
- Correct Joins: correctly connect data. Deal with multi-hop joins or duplicate rows. Avoid fan traps and chasm traps to avoid wrong results or data explosion (surprisingly hard!).
- Correct Dependencies: understand calculation lineage and know how to apply context between steps. Understand pre-aggregations and when they can apply.
- Correct Time: understand time spines and handling missing data, know how to join dates to data, or how to construct a year-over-year or a year-to-date metric.
- Performance: filter pushdown, join pruning, leveraging pre-aggregated data (and knowing it is valid), balancing cost and flexibility.
And with less context to process, the LLM is cheaper too!
Or in practice,
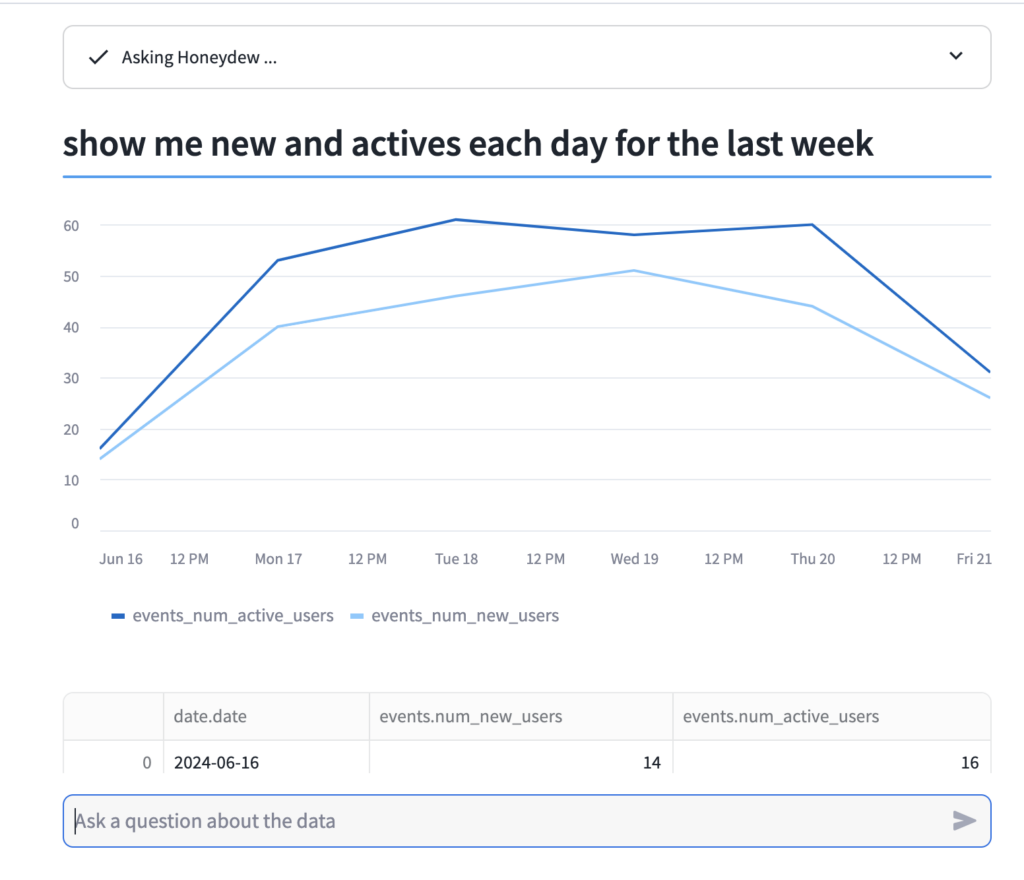
The User Perspective
When Joe asks a question from this “AI” black box that now has a semantic compiler, Joe gets the following advantages:
Correctness and Accuracy
The best Text-to-SQL systems achieve ~80% accuracy on test benchmarks. With larger real-world schemas (over 100 business objects or 20 tables) accuracy drops considerably.
Most text-to-SQL evaluations don’t distinguish between accuracy and correctness (as long as the SQL compiles).
However, with a semantic layer (such as Honeydew), it is possible to achieve 100% correctness and >95% accuracy with >10,000 business objects and any (unbounded) number of tables underneath.
Correctness is a given: a semantic compiler will always produce correct joins and metric calculations. Accuracy with a semantic layer means a different thing: choosing the appropriate metrics for a user question. Inaccurate = you meant active users, but the LLM picked total users.
Explainability
When you get a number, how do you know it is wrong?
Text-to-SQL LLM that generates a wrong calculation escapes scrutiny: many times it is impossible to notice a wrong result in a complex SQL, even for an expert eye. For business users blindly trusting numbers (until they don’t!) it is beyond realm of imaginable.
It is easy though to know when an AI picked a wrong metric: it has a name. Oh, total users? I meant active users. No, not this weekend, I meant last weekend. It uses the same language as the business user, allowing corrective instructions to the LLM.
But with an LLM generating SQL directly, even if the user smells a wrong answer, there is no direct way to provide guidance at that level.
Time to Value
A semantic model (such as Google Analytics) is repeatable. Build it once, and every Google Analytics data will conform. The particular business context of using Google Analytics in a specific company is unique – different companies care about different things and correlate a website visit with different pieces of data.
With a semantic model, you only need to worry about training for your particular business context (where “training” essentially means expanding the semantic model). The baseline is a trusted and a “hard truth” to adjust to your needs while maintaining full control of it.
The New Job of a Data Team
Data teams with semantic layers are the Department of Transportation. They maintain the roads. They put a warning sign around road construction, directing traffic to a bypass. They close dangerous bridges that lead into lakes, and redraw bad maps that point there. They figure out where there is congestion and design better roads. They understand which road signs are misleading. They know which traffic lights are annoying. They are Waymo’s maps team.
In short, you can’t drive anywhere without them.

The data team’s first job in the world of AI is to maintain the hard truth.
Knowing data, they might give good suggestions on how to use it – ask them about the best way to get from point A to point B and they’ll know how to answer. Sometimes better than AI. But if they maintain the roads right, you don’t have to ask them. You can use Waze. Or an LLM.
But they are also the ones who need a SQL-making LLM!
In the very immediate term, they can write SQL faster:
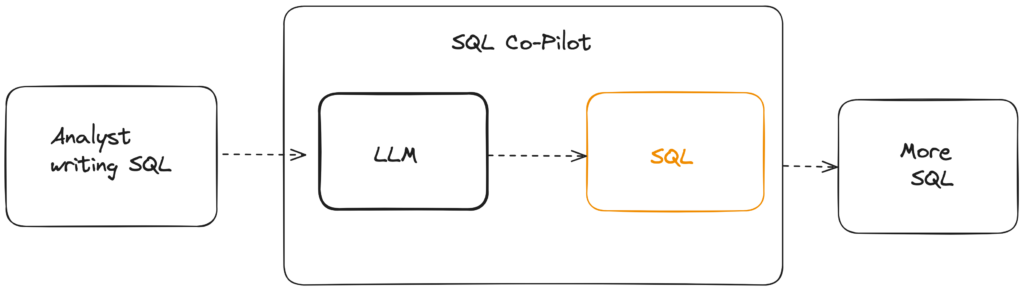
The New Job of SQL-generating LLMs
LLMs can help data teams design better roads. It can help them build a better semantic model, faster.
- One LLM helps data teams design roads (by helping them build new metrics and calculations).
- Another LLM helps business users drive the roads (by using those metrics to answer questions).
In combination, there can be accuracy at scale, explainability, and control.
Will both those steps converge in the future, until the gap in between is so tiny you hardly see it? With AGI, they might.
But as long as there is a gap and a semantic model to review and rely on, there are hard truths – and people, talking to their data out loud.