Excel, live
on your
warehouse
Excel becomes a governed BI tool.
Business users build native pivot tables on the full warehouse, and every number matches the dashboard and the AI answer - same metrics, same access rules, compiled from one governed model.
Try clickable demo:
A cube to Excel, a dynamic layer underneath
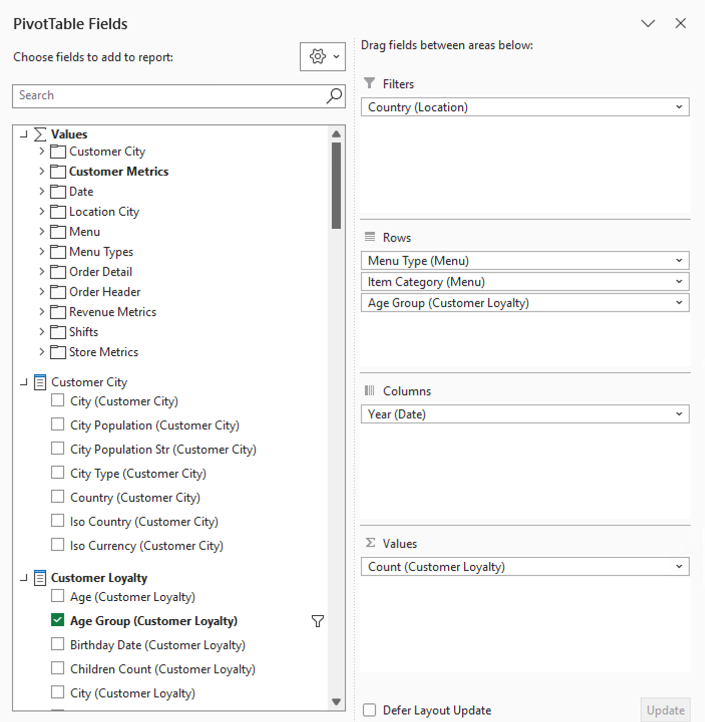
Excel connects over XMLA and sees a governed domain as a multidimensional cube: entities as dimensions, attributes as hierarchies, metrics as measures. Underneath, the semantic layer compiles each pivot against the live warehouse.
Drill-down, slicer filters, grand totals, and right-click drill-through work in the native PivotTable - no add-in. The XMLA endpoint works with Microsoft Excel.
Live pivots on billions of rows
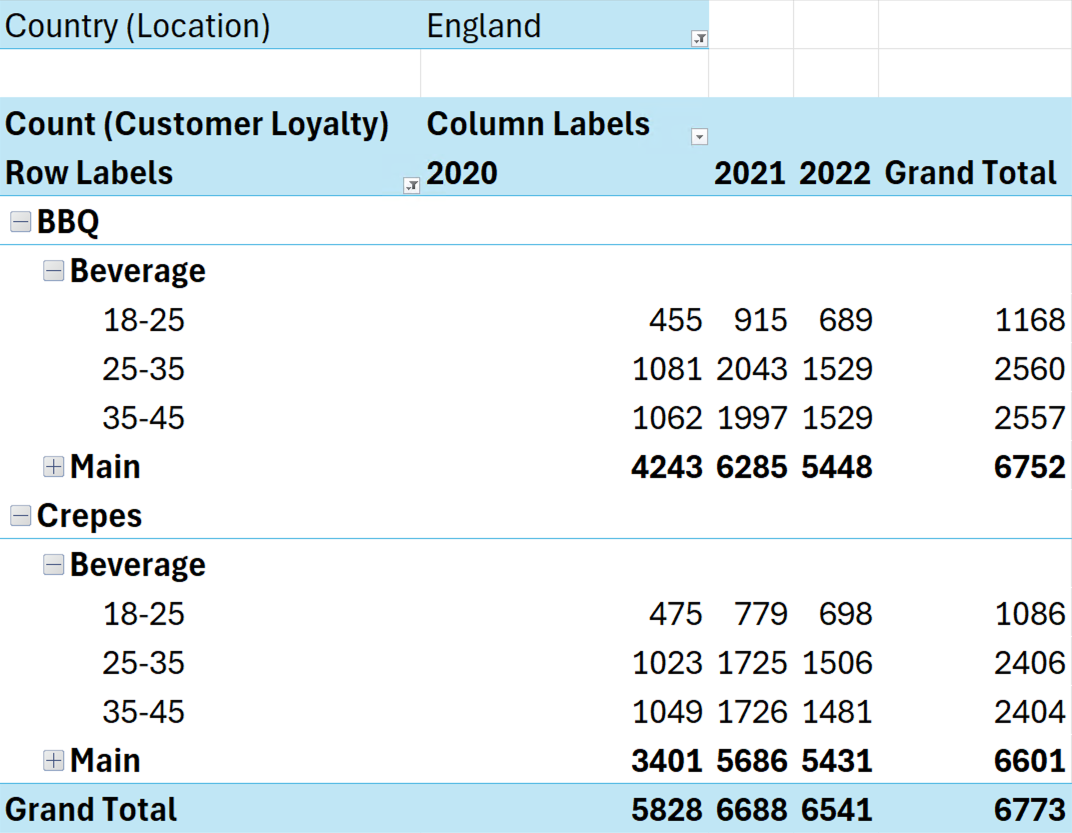
A pivot refresh asks for every level, subtotal, and grand total at once. The engine is built for that shape - one compiled query per refresh, whatever the sheet asks for.
When a subtotal branch of the pivot has a pre-aggregated table behind it in your warehouse, the compiler reads from there instead.
One compiler, every surface
A pivot refresh, a Power BI dashboard, and an AI answer compile from the same governed model on Snowflake, Databricks, or Google BigQuery - same metrics, same joins, same row-level security.
Right-click a pivot cell to open a governed AI analysis carrying that cell's metric and filter context.

Start with one pivot table
Connect Excel to a governed domain and refresh - then open query history and read the one compiled query it produced. Every level, subtotal, and total came out of it.